knitting to pdf
I’ve never really liked the default font that is used when Rmd knits to pdf. When knitting to pdf, R uses LaTex (which is why you often need to install the tinytex package) and the default in LaTex is called Computer Modern. You can customise fonts, size, and line spacing in the yaml. To change the font style you need to use a LaTex engine like xelatex and specify the mainfont (your main text) and monofont (code chunks and output).

making maps with R
For code club this week we were working with the Tidy Tuesday data about registered nurses in the US. When you have data about numbers of nurses employed and median wages by state over time, the obvious thing to do is make a map! Something I haven’t done in R before, so thought it might be useful to document my process. first google When I am trying something completely new in R, I generally google “how to do X in R blog”.
parameterised penguins
How to use parameters and purrr to render many Rmd reports I am beginning a project where we want to create a distill site that has lots of profile pages that all have the same format but pull different data from a dataframe. Here I am learning how to use set up parameters within RMarkdown so that I can use purrr to render many reports at once. how to customise your yaml yaml stands for “yet another markup language” and it is the code that you see at the top of your RMarkdown document that is between the sets of dashes.
PAT for GitHub
I have been avoiding setting up a Personal Access Token to authenticate my github account for a while because it seemed complicated. Never fear Happy Git with R and usethis() to the rescue. create a token install.packages("usethis") library(usethis) usethis::create_github_token() This will take you to github and create a token for you. Accept the defaults and copy the token. Go back to RStudio store it in your credentials install.packages("gitcreds") library(gitcreds) gitcreds_set(url = "https://github.

across and summary tables
Thanks to Tom Mock for saving me from this blogpost on twitter. I was monster number 6… beginning to convince myself that there were gremlins in the across() function. In fact, I had forgotten the golden rule: don’t make objects that have the same names a functions That is for another post… the across() function I have been playing with the new across() function in dplyr which is a magical solution when you are looking to get several summary statistics across a range of variables.
my first pull request
There are so many lovely packages for colour palettes (see links at the bottom of this post for more). This new one called feather by Shandiya Balasubramanium is inspired by Australian birds and is delightful. Today I built my first R package! Meet feather: a set of colour palettes inspired by the plumage of Australian birds. It's a work in progress and a bit rough around the edges, but I'm pretty proud of it#RStats #WildOz #DataVisualization https://t.

functions to save you time
Last year my R resolution was to google less. I think I succeeded (kinda). I wrote a few posts in my IDHTG series. counting things recoding variable work with factors annotating plots use colour palettes I don’t necessary remember exactly how to recode variables or to make factors behave, but I know I have notes in my blog about those things to refer to, so that makes the googling much faster.

cleaning penguins with the janitor package
The janitor package by Sam Firke contains probably my FAVOURITE R function: clean_names(). By default when I am reading data into R, I pipe clean_names() onto the end of my read_csv(). I never have to look at inconsistently formatted variable names. But janitor package includes lots of other useful functions that make it easier to deal with dirty data and count stuff. new_df <- read_csv(here("data", "df.csv") %>% clean_names()) Exploring package functions Are you keen to dig into the little known functions of a package that you use all the time?

idhtg how to use colour palettes with ggplot
If I had a dollar for everytime I have googled how to change the colours in my ggplot…it is clearly time for a “I don’t have to google” post about it. library(tidyverse) library(palmerpenguins) library(RColorBrewer) library(harrypotter) penguins <- penguins make a couple of basic plots When dealing with geom_point(), you can use colour to change the colour of the points. For geom_col(), you need to use fill; colour will change the border around your bars.

lubridate parsing dates automatically
I’ve been looking at old Tidy Tuesday datasets this week to try and work out why sometimes date data is automatically parsed as dates, like in the palmer penguin dataset… # read data from Tidy Tuesday penguins_raw <- readr::read_csv('https://raw.githubusercontent.com/rfordatascience/tidytuesday/master/data/2020/2020-07-28/penguins_raw.csv') %>% clean_names # check class class(penguins_raw$date_egg) ## [1] "Date" # pull first date observation penguins_raw$date_egg[[1]] ## [1] "2007-11-11" And other times R thinks dates are characters, like in the marbles data.

IDHTG how to annotate plots
A new post in my I Don’t Have to Google (IDHTG) series. I’ve been wanting to work out how to add annotations to plots for a while and this plot from the @WeAreRladies account this week got me inspired! I also looked at activity by week. You can see that there are some weeks when there was a break between curators. You can also see curators are totally different - both in terms of number of tweets and the number of retweets and replies.

lubridate characters to dates
Art by Allison Horst @allison_horst So far I have learned that lubridate has some nice functions for pulling date components like day, month, or year and using them within group_by() and summarise() or ggplot(). But most of the time when I am working with date data in the real world, R doesn’t even think my dates are dates. Most of the time date data that I read into R gets parsed as characters.

lubridate month() + wday()
Art by Allison Horst @allison_horst When I am trying to work out a problem with R, I generally skip the package documentation, I avoid stack overflow, and I go straight for a blog post written by someone who has just learned what I am trying to learn. I think when you have just learned something, you are in THE BEST PLACE to teach someone else. You are acutely aware of what it feels like to not “get it”.

lubridate first google
I have set myself a challenge of learning to deal with dates in R. Nothing like setting a date for an R-Ladies Sydney event where you will teach other people to spur the motivation for learning how to use the lubridate package. The plan is to learn how to use the package and document my learning process along the way so that at the end of Oct I can tell everyone…

group_by and summarise
Some students have been asking me how they can calcuate means and standard errors by condition. Here is a quick example using the palmer penguin data. Details of the palmer penguin data, with art by Allison Horst, can be found here. load packages library(palmerpenguins) library(tidyverse) read in data penguins <- penguins glimpse(penguins) ## Rows: 344 ## Columns: 8 ## $ species <fct> Adelie, Adelie, Adelie, Adelie, Adelie, Adelie, Adel… ## $ island <fct> Torgersen, Torgersen, Torgersen, Torgersen, Torgerse… ## $ bill_length_mm <dbl> 39.
calculating z scores
The scale() function will center and/or scale a numeric object. Use center = TRUE to subtract the mean from the values; use scale = TRUE to divide the centered values by the standard deviation to produce z scores. center variable A scale(A, center = TRUE, scale = FALSE) generate z-scores for variable A scale(A, center = TRUE, scale = TRUE) Lets try it with EMG data

ggplot tricks
Here are some ggplot tricks that I shared at the R-Ladies Sydney June Show and Tell. Why is my internet speed so terrible? Working from home and pivoting to teaching online has made me realise that my wifi connection is really bad, particularly when it rains. I have been teaching new honours students R and needed a little dataset to demo how to get data into R, so made a google form and put it out on twitter to confirm to myself that my connection really is worse than most other people.

Spending in COVID
There is no doubt that COVID19 has massively disrupted how we spend our time and money. In this post, I update code inspired by this R-bloggers blog to look at how much less money we have been spending on eating in the last month, compared to April 2019. Download a copy of your bank transactions in csv format. Load packages library(tidyverse) library(janitor) library(lubridate) Read in data Clean and rename, select just date, description, debit amount, add new column for class with default value = “Other”

IDHTG recoding variables
I don’t often deal with questionnaire data in R, but Ariana and I have started trying import her qualtrics data into R and to write a script to score her measures. The first step is to recode the variables to make it possible to add up scores on subscales. load packages library(tidyverse) make a little dataframe df <- data.frame("pp_no" = 1:12, "sectionA_1" = c("Strongly Agree","Agree", "Disagree","Strongly Disagree"), "sectionA_2" = c("Strongly Agree","Agree", "Disagree","Strongly Disagree"), "sectionB_1" = c("Frequently","Sometimes", "Infrequently"), "sectionB_2" = c("Frequently","Sometimes", "Infrequently")) Option 1: use mutate() and case_when() My first intuition is to use case_when(), which I have written about before.

IDHTG counting things
Sometimes things that are really easy to do in excel are not so intuitive in R. Like counting things. Because most of the time I am working with data in long format, you can end up with hundreds of observations, so functions like length() aren’t useful. Today I just wanted to check how many participants were in this dataset and it took me some significant googling. load packages library(tidyverse) library(ggbeeswarm) library(janitor) create a little df df <- data.

IDHTG working with factors
I use read_csv to read data into R and it most conservatively assumes that when you have text in a variable you are dealing characters (not factors). Of course these things are often factors so you need to explicitly convert them if you want to use the factor in an analysis or have it appear the way you want in a ggplot. The forcats package will do this with as_factor

things i dont have to google anymore
My 2020 Resolution There are a lot of things I do in R that I have to google EVERY TIME. My 2020 R resolution is to try and google less. I want to commit a few of these really frequently used things to memory. The key to that: write a blog post about each one. That way, even if it doesn’t stick, I can always just google my own blog.
what did we just do?
I started a blog post and pushed it to the git repo that contains my blog. Charles forked my repo, cloned it to her machine, contributed to the post, and then pushed the updates to her forked copy of the repo. Then she did a pull request. People in git-land talk about PRs (pull requests) all the time, and the term seems backwards to me. A pull request is when you request that the owner of a repo “pull” the changes that you have made.

serious git thinking
I have been a git user for 513 days. When I was first setting up this blog, my dear friend Charles T Gray helped me learn the 3 terminal commands that you need to know to interact with git in the most rudimentary of ways. git add . git commit -m “something meaningful” git push Since then I have mostly just used these 3 commands to push blog posts to git.
best stats meme ive seen in a while
Just putting this here because I’m sure it will come in handy some day. not untrue https://t.co/TR8uueTsk9 — Shit Academics Say (@AcademicsSay) October 8, 2019

insights from the RMarkdown whisperer
I had the pleasure of attending Alison Hill’s RMarkdown workshop in Canberra on Monday and I came away with so many tips and tricks! It was brillant. Alison covered A LOT over the course of the day. I learned lots of the power of yaml, how to create parameterised reports, and how to make a package that contains customised .Rmd templates. Each of those topics are blogposts for another day, but my favourite bit was making a beautiful Academic theme blogdown site.
mutate + if else = new conditional variable
I keep googling these slides by David Ranzolin each time I try to combine mutate with ifelse to create a new variable that is conditional on values in other variables.

customise your R experience
Would you like RStudio to show you a random The Good Place quote, spoken by a ASCII animal along with some random message of praise/encouragement each time you start a coding session or restart R? Of course you would!!! how to customise your .rprofile You will need to install the following packages: usethis goodshirt cowsay praise Use usethis to open your .rprofile file usethis::edit_r_profile() Copy and paste this text into your .
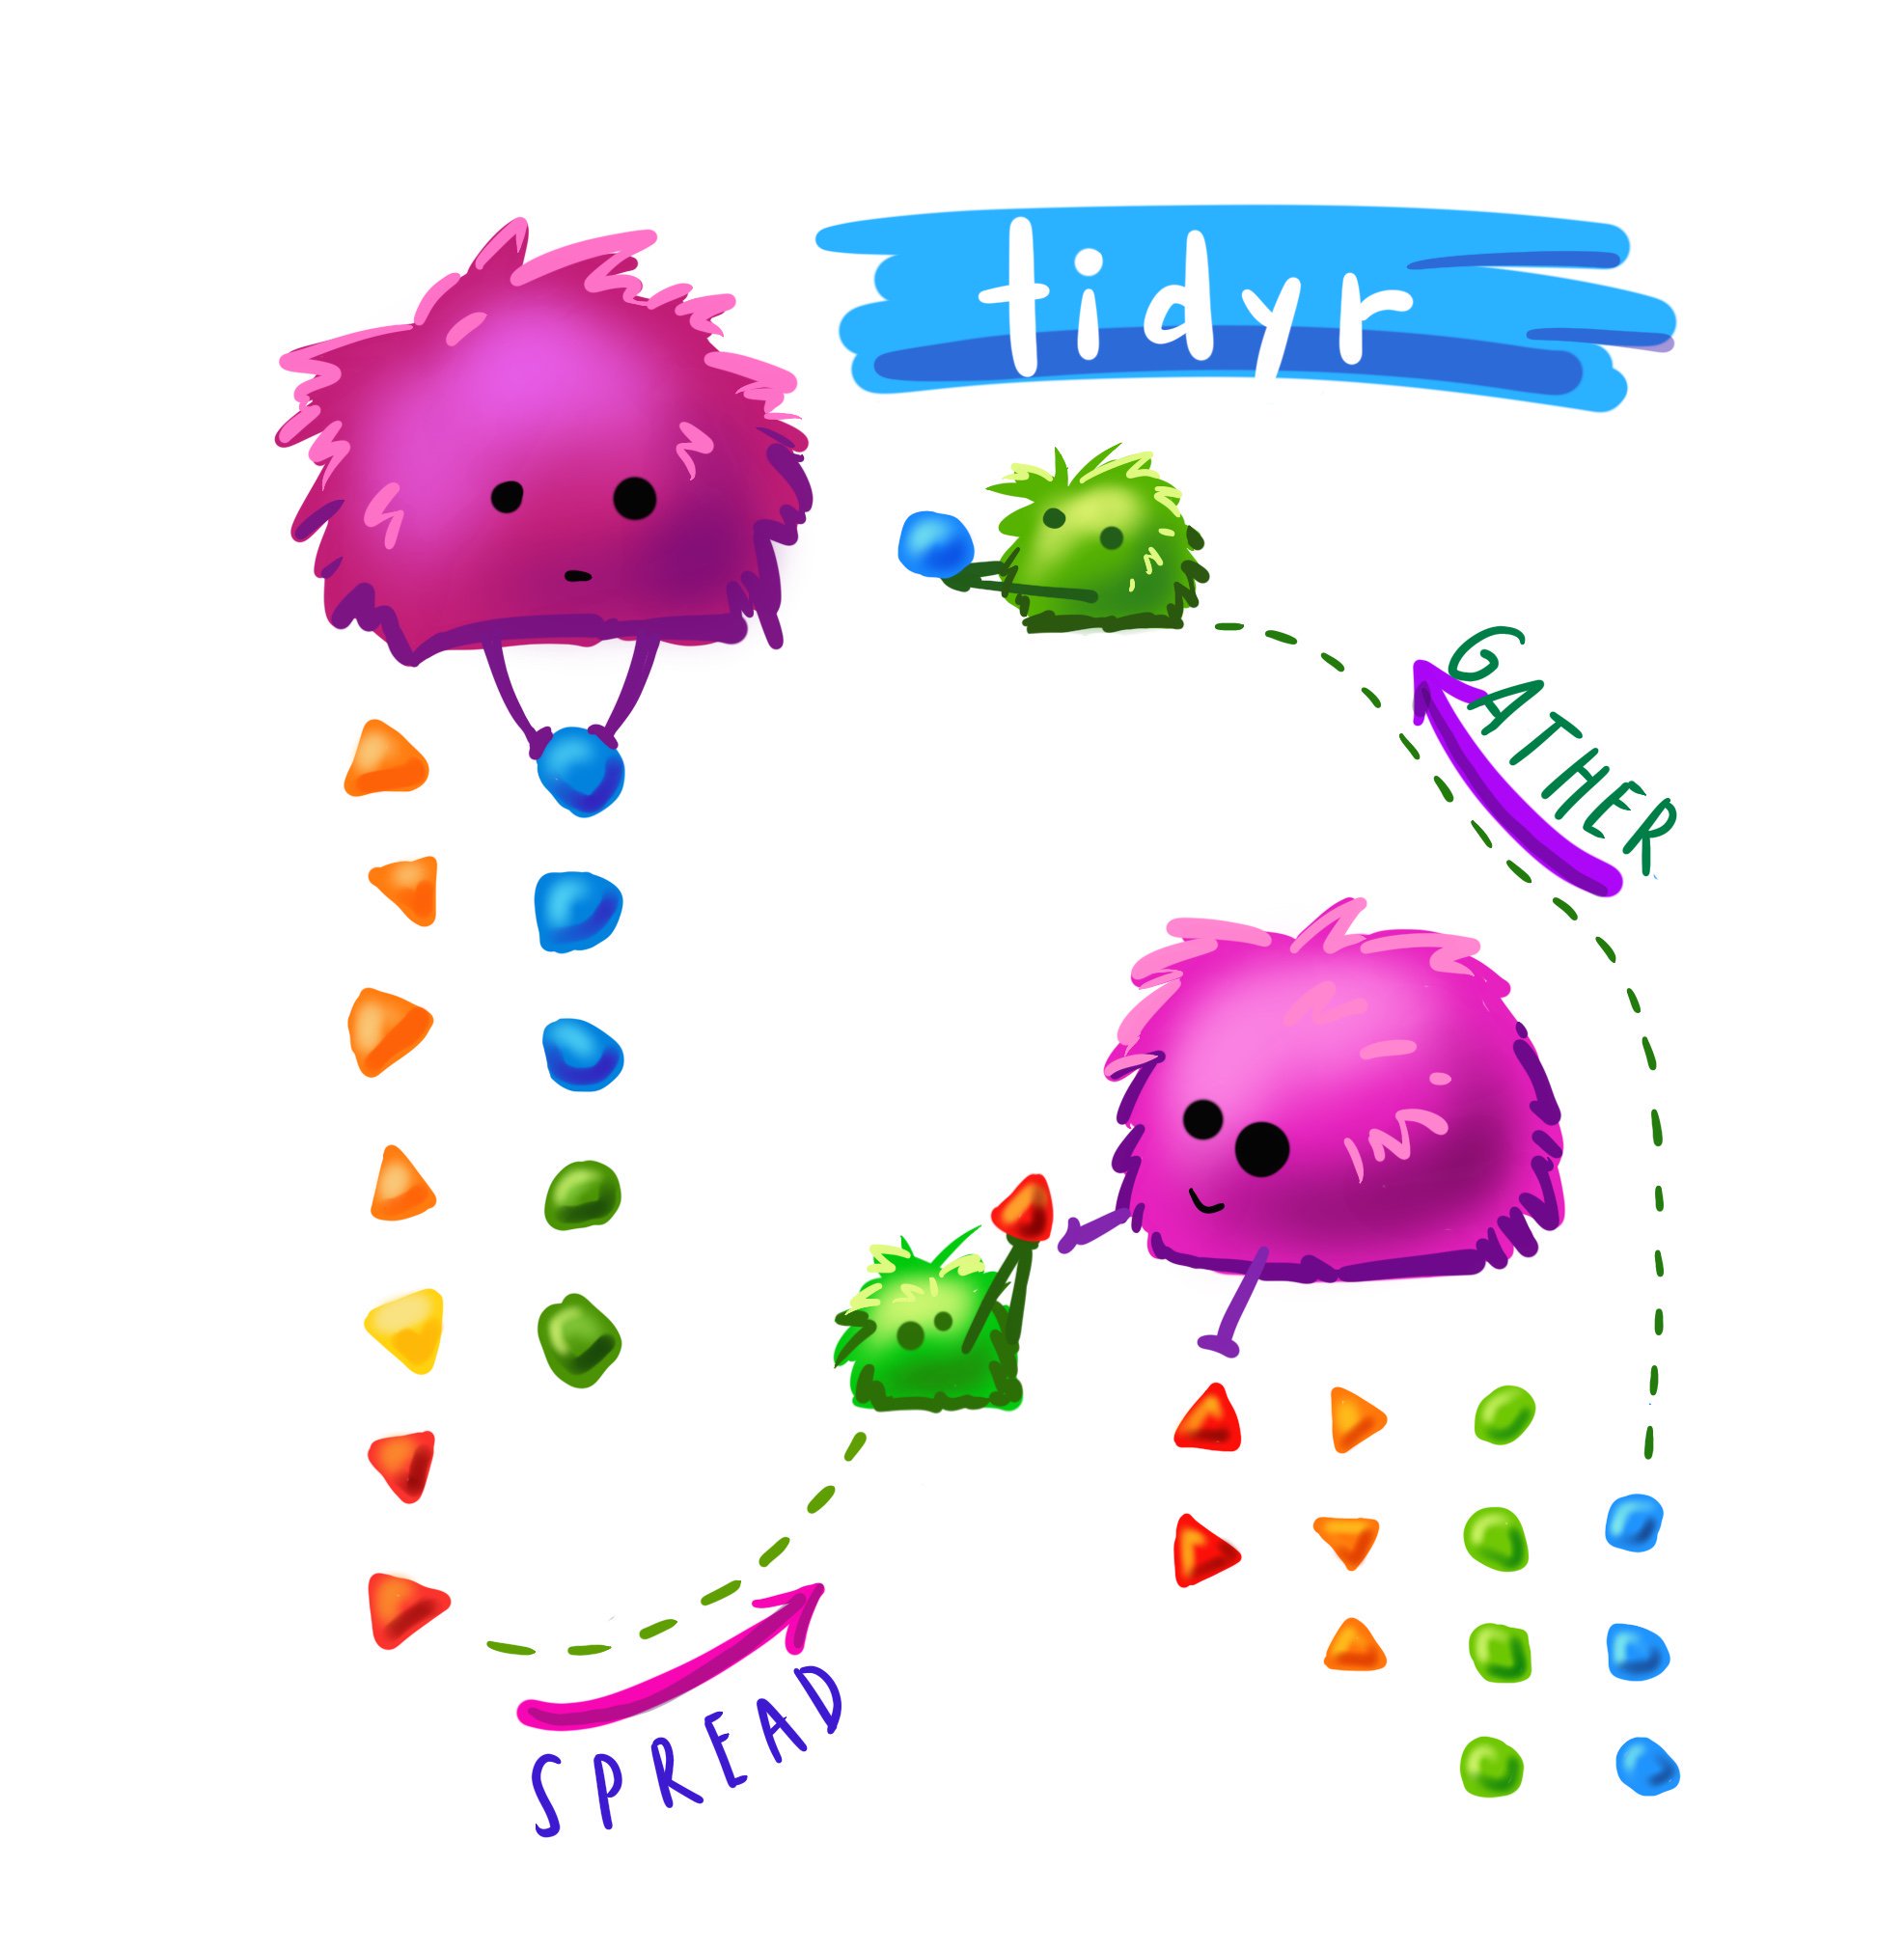
Pivoting
Cute #rstats monster art by the amazing Allison Horst. knitr::include_graphics("gatherspread.jpeg") I have been using gather() and spread() a lot lately. I’m on the tidy data train; long data is essential for ggplot etc, but sometimes you want to do calculations row wise, which is kinda complicated. For example, this week Matilda and I were working with her language/locomotion data and we were looking at the number of action-directed, affirmative, and descriptive responses that parents make to their infants.

making memes in R
I having been prepping for my lightning talk at the R-Ladies Sydney Birthday this weekend and learning about all the packages that you can use to make memes in R. I’m going going to talk about my favourite option (which is the memery package), but here is what I learned about other packages. Option 1: memer The memer package by Sam Tyner is a tidyverse compatible package that allows you to replace text in popular memes with your own.

apa figures
As I write my first paper reporting data analysis coming out of R (woot!!!), here are some notes summarising all the googling I have done this morning about how to produce APA style figures in ggplot. via GIPHY Load libraries Start by loading tidyverse to get ggplot, here to make finding the data easy, and papaja to get the theme_apa() function. library(tidyverse) library(here) library(papaja) Read in data plotdata <- read_csv(here("plotdata.
blogdown
There has been lots of talk about blogdown on #rstats Twitter recently and people have been talking up the Hugo “Academic theme”. I want to give it a go to update my lab website, so thought it might be a good idea to pull together all the useful links I’ve seen recently into one place. Alison Hill I used Alison’s blog post when I first set up this blog. It looks like she has updated the post recently, so it is probably still a good place to start.
newposttest
I think I have broken hugo testing whether this works
rm anova options
I’ve been analysing some future thinking data and playing around with packages that can do repeated ANOVA (I know, I should do LMM). There is more than one way to skin a cat and the differences come down to two things. the intuitiveness of the function arguments the readibility of the output Some checks to do before you start all of these packages assume that you within and between subjects variables are factors, but also that your participant id is a factor A few favourites Option 1: old school aov() This code comes from the ANOVA cookbook
Just Three Things
I love me a good #rstats screencast. David Robinson has been screencasting his #TidyTuesday efforts for the past few months and while it is GREAT to watch a master at work, I just don’t have time to watch someone code for an hour, in order to extract a handful of tips. So when I saw Nick Tierney tweet about posting short videos that contain Just Three Things, I thought “that is a GREAT idea.
infinite moon reader
I saw an intriguing tweet this afternoon. 🧙 ♂️Live preview for R Markdown! TIL that you can have a live preview of your #rstats Markdown docs! Just use the infinite_moon_reader function from the xaringan package. It works for all single-HTML-file outputs and even comes with a pre-made RStudio Addin! — Jozef Hajnala (@jozefhajnala) January 2, 2019 When Charles was visiting for #RCurious in June, she had written her slides in xaringan and was raving about infinite moon reader.
how to add a gif
Sometimes your plot needs a celebratory gif. I have just finished the vizwhiz module for #RYouWithMe and to top off the series I worked out how to add an RLady Wizard to our final plot. Just so I’ll remember for next time, here is a step by step how to… knitr::include_graphics("beachwiz.gif") how to add a gif to your ggplot Install the magick package and load it with ggplot. Install and load the beepr package too so you can have RStudio beep at you when it has finished rendering your gif (it can take a long time).
how to use the `here` package
I’m still working on getting my head around where R thinks we work and how to tell it where my stuff lives (aka working directories). On twitter yesterday Alison Hill, Adam Gruer, Zoe Meers and Irene Steves helped me sort out my issues with here. hi #rstats friends, how do YOU use the `here` package? I thought I had my head around it but I'm doing something wrong. Here my markdown lives within the "markdown" folder, so I set here to the "data" folder, call read_csv(here("datafile.
things i googled this week
How would we learn R if not for google? Here are some things I googled this week (and mostly not for the first time). 1. how to install a package from github. 95% of the time, packages I want are on CRAN and I can just use the install.packages function to install them. install.packages("nameofthepackage") Occasionally though, I see something cool and new on Twitter and need to install from github. Everytime I forget that you need to use devtools.
Writing about LMM
Learning new things is HARD. Stats methods are particularly hard because it not just about running the test. You have to… learn when to run the test learn how to run the test learn how to interpret the test AND learn how to write about the results of the test Part of what makes this learning hard is that our research methods training has drummed into us that there is a RIGHT WAY TO DO IT.
let me count the ways
When we want to learn how to do something new in R, we all start by googling it. Having worked out simple ANOVA, next on my list is repeated measures. Domnique Makowski has an excellent blog post that comes up at the top of the search results when you google “how to do repeated measures ANOVA in R”. He lures you in with a post that seems like it is going to solve all your problems and then and BAM… starts the post by saying “DON’T do it”.
where is here?
As I add new projects to my rstats portfolio and work collaboratively on projects with students the issue of working directories is becoming more and more complicated. Not really understanding how working directories and file paths actually work, I have been relying on the beginner logic… Everything will be just fine as long as you keep your datafiles in the same folder as your .rmd file via GIPHY
gather spread unite separate
This content has appeared before in a dirty data post, but I still find myself googling these functions. So they deserve a post of their own. The tidyr package has several functions that allow you to reshape your data. They are surprisely useful; I have found myself gathering a lot, mostly to get data from “SPSS format” into something that ggplot will handle. I have also discovered the flexibility with which you can spread the data on a particular variable, do a set of computations, and then gather it back for plotting….
next up anova
In the kind of research that we do, t-tests can only take you so far. Most often we design factorial experiments where we are interested in both main effects and interactions. Because we work with infants and young children, who are both expensive to recruit/test and notoriously variable in their behaviour, we try to design experiments that use within-subjects designs; each child gives us more than one data point and we need to use repeated-measures analyses.
more wrangling tips
It is definitely true that it takes much longer to get your data ready for analysis than it does to actually analyse it. Apparently up to 80% of the data analysis time is spent wrangling data (and cursing and swearing). Did you know up to 80% of data analysis is spent on the process of cleaning and preparing data? - cf. Wickham, 2014 and Dasu and Johnson, 2003 So here is an excellent approach to data wrangling in #rstats https://t.
testing out t-tests
I was trying to work out how to do t-tests using my own data and the lsr package but ended up working with Dani’s AFL data from her book while trying to work out why R insisted that my outcome variable wasn’t numeric (it definitely was). Turns out that the lsr package doesn’t deal well with tibbles (which are created by default when you use read_csv to get your data) but if you use read.
using R for analysis
I am feeling more confident about my resolution to get rid of Excel and only use R for data wrangling and visualisation. Next steps… analysis. I’m starting simple (I presume) with t-tests. Mostly commonly I want to determine whether there is a difference in the performance of independent groups of kids, or a difference between kids' performance on two different conditions, or whether kids are just guessing (i.e. whether their performance differs significantly chance).
creating data using rep()
The frequency with which my data is missing important information when it gets to R is a bit embarrassing. I’m sure as I learn what kind of information R needs I’ll get better at this but for the moment using functions like rep() to create variables like trial number or block has been super useful. Alison Smith has a great blog called Very Statisticious and her post about simulating data is super helpful.
Use map to read many csv files
Dipping my toes in purrr here and replicating options from a super useful blog post I found by ClausWilke How to use map() to read in and bind together several .csv files Option 1 The simplest option; use when your .csv files contain ID/participant and all live your working directory Get list of .csv files called files. The code below looks for files that have .csv as part of the filename in the the working directory
I don’t like cats much
I don’t love cats. I am not a member of @RCatLadies. So the fact that Tidyverse packages for dealing with factors and functional programming have cat-related names (forcats and purrr) does not endear them to me. I knew there was a time when I would encounter an R problem that needed the power of for loops, so when I asked the Twittersphere whether there was an alternative (hopefully a tidyverse one) that would allow me to avoid loops a little longer, I was a bit disappointed to hear that it is the purrr package.
lesser known stars of the tidyverse
Emily Robinson writes a great blog called www.hookedondata.org. She talked at the 2018 New York R conference recently and shared some of her favourite (less well known) stars of the Tidyverse. Here are her slides www.tiny.cc/nyrtalk and my notes… 1.use as_tibble() Tibble = modern dataframe. Use instead of printing your dataset to the console. as_tibble() will only print the first 10 rows and columns that fit on the screen. 2. examine your NAs is.
dirty data
I have been doing lots of data wrangling recently and decided a needed a quick rundown of data cleaning in R. Here are notes on useful things I learned recently. Quick summaries class() will let you know whether you are working with a dataframe or not dim() gives you a little info about the dimensions of your data by telling you how many rows nd columns you have names() will print the column names
hotkeys
There are some commands that as I get more and more familiar with Rstudio I find myself typing again and again. Keyboard shortcuts are helpful (disclaimer: these mac versions). Option-Command-i will open a new Rmarkdown code chunk. Option - is a handy way of typing assignment (<-) Shift-Command-M is a fast way of adding a pipe (%>%) A little googling and here is a whole list that I am yet to learn.
cooking with datapasta
Another day… another data set. This time I am trying to get EMG data from LabChart into R. LabChart is the software we use to record EMG data and do the first steps of data cleaning/processing. At the moment a good chunk of the cleaning process involves Excel macros, so my goal is to replicate what we have traditionally done in Excel in R, so that it is more automated and more reproducible.
calculating age
I have been playing with a new (not actually new, but new to R) dataset this week. Successes: I loaded the data in using read_csv. I made dates into dates. The interview group is listed as 1s and 2s in the file so R thought those were integers. So I used as.factor to convert. dataframe$variable <- as.factor(dataframe$variable) I used lubridate package to specify that DOB and Test_date were dates with Day Month Year (dmy) format.
fomo on #useR2018
I have been travelling for the last few weeks, first to a teaching conference at Duke called PsychOne, and then to the International Congress on Infant Studies (ICIS) in Philadelphia. There was a surprising amount of #rstats at ICIS which was awesome. Everyone is talking about reproducible science and preregistration and best practices that will improve our field. There is definitely another blog post needed to consolidate my notes from ICIS, but for now, I want to write about #useR2018 (a conference I didn’t get to go to).
curious
What a treat it was to finally meet Charles Gray when she was in Sydney last week. She ran her R-Curious workshop for us and I picked up so many useful markdown tips. We worked from an Rmarkdown document in the workshop so we could edit the code and add our own notes but we could also how Charles had used specific markdown formatting to produce the document. Because it was a “lets start at the very beginning” workshop, made me realise that when you teach yourself how to code, there are basic (but quite useful) that you don’t end up learning via osmosis.