Pivoting
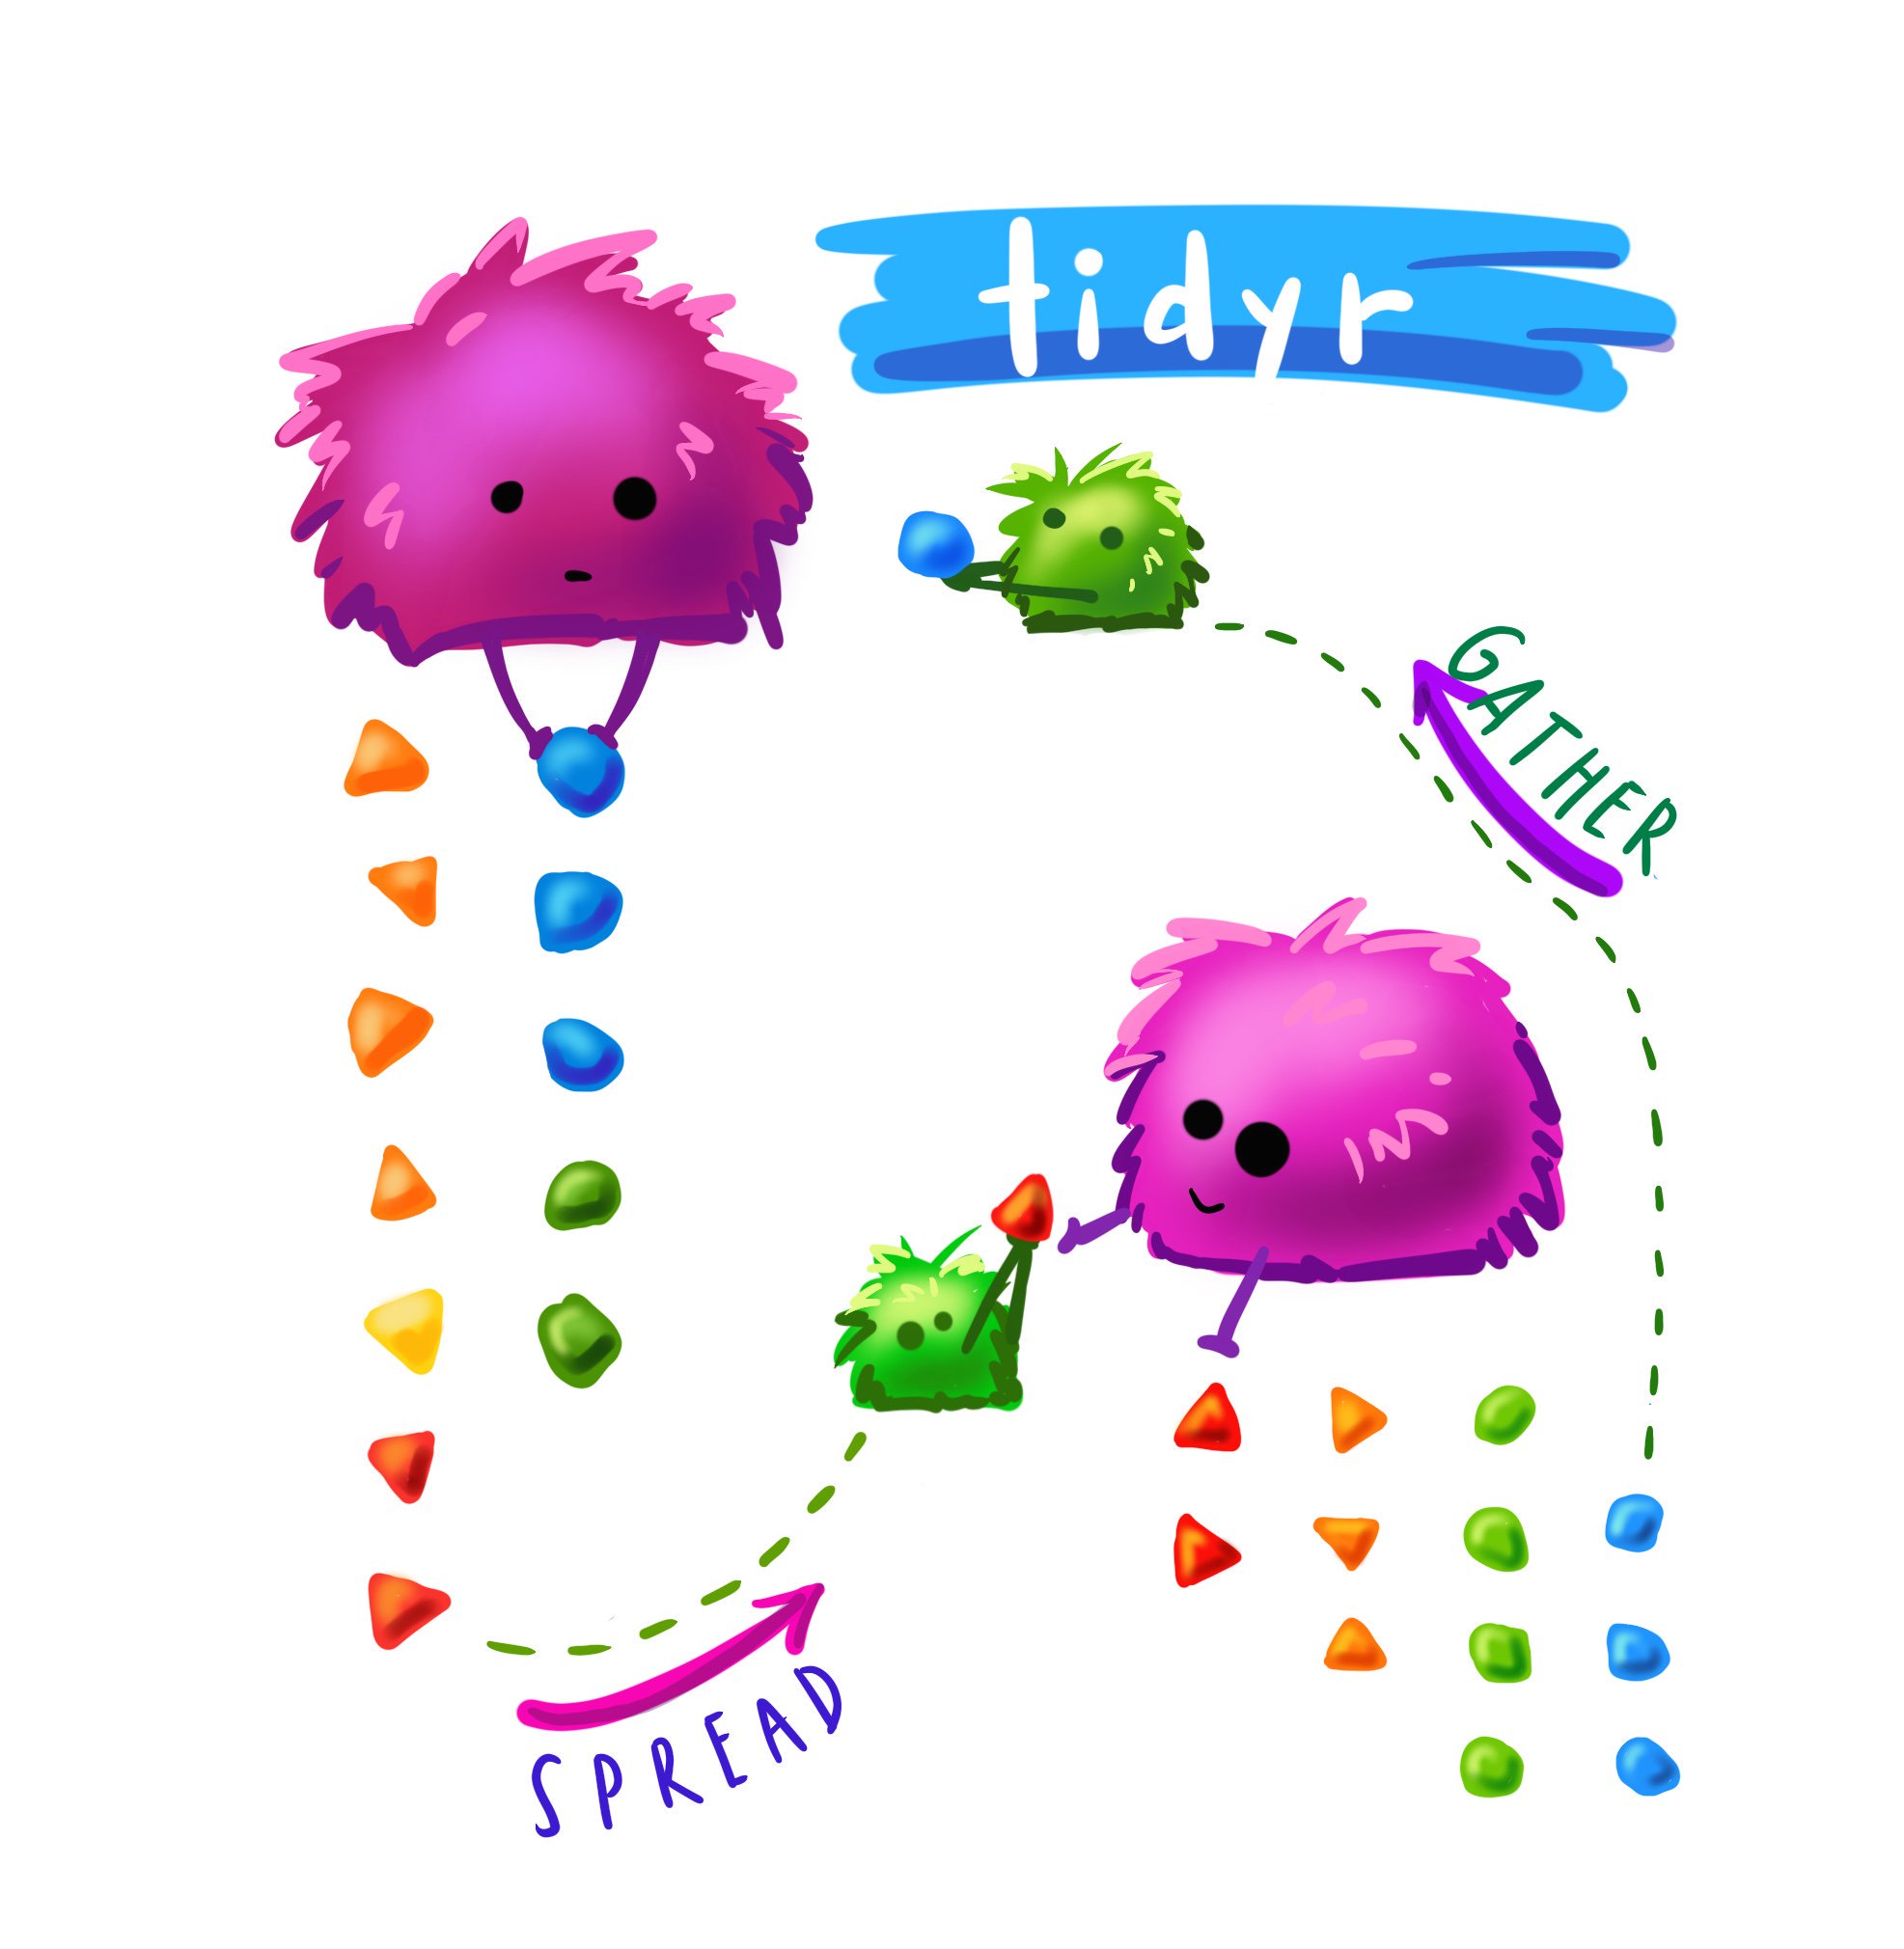
Cute #rstats monster art by the amazing Allison Horst.
knitr::include_graphics("gatherspread.jpeg")

I have been using gather() and spread() a lot lately. I’m on the tidy data train; long data is essential for ggplot etc, but sometimes you want to do calculations row wise, which is kinda complicated.
For example, this week Matilda and I were working with her language/locomotion data and we were looking at the number of action-directed, affirmative, and descriptive responses that parents make to their infants.
library(tidyverse)

loco <- read_csv("locoresp.csv")

head(loco, 10)
## # A tibble: 10 x 6
##    pp_no   resp_type age_months loco_stats count resptype
##    <chr>       <dbl>      <dbl> <chr>      <dbl> <chr>
##  1 AE1104          1         12 w             10 affirmative
##  2 AE1104          2         12 w              5 descriptive
##  3 AE1104          3         12 w              5 action_directed
##  4 AH2312          1         12 w              8 affirmative
##  5 AH2312          3         12 w              5 action_directed
##  6 BE2005          1          9 c              2 affirmative
##  7 BE2005          2          9 c              3 descriptive
##  8 BE2005          3          9 c              1 action_directed
##  9 BE2005c         1         12 w              5 affirmative
## 10 BE2005c         2         12 w              4 descriptive
The raw response rates are interesting, but there is MASSIVE variability. Some mums are chatty-Kathy and others say almost nothing. Also some mums have no responses in one or more categories.
It is helpful to express each type of response as a proportion of the total. That is hard to do because it involves row wise calculations for each participant. So instead, I have been spreading the data wide so that the count of each kind of response ends up in a different column, then calculating totals and proportions and then gathering the data long again.
Here is how that works…
This chunk makes a new df called loco_wide by taking the loco df, ditching the old numbered resp_type variable then spreading the new wordy resptypes across columns.
Using na_replace() from the narniar package, all the NAs are replaced with 0. Then use mutate() to make a new total column that adds affirmative + descriptive + action-directed responses, and makes three new proportion columns. Then select just pp columns and the new proportion variables.
spread_loco_wide <- loco %>%
  select(-resp_type) %>%
  spread(key = resptype, value = count) %>% replace_na(list(affirmative = 0, descriptive = 0, action_directed = 0)) %>%
  mutate(total = affirmative + descriptive + action_directed) %>%
   mutate(prop_aff = affirmative/total,
         prop_desc = descriptive/total,
         prop_action = action_directed/total) %>%
  select(pp_no:loco_stats, starts_with("prop"))

head(spread_loco_wide, 3)
## # A tibble: 3 x 6
##   pp_no  age_months loco_stats prop_aff prop_desc prop_action
##   <chr>       <dbl> <chr>         <dbl>     <dbl>       <dbl>
## 1 AE1104         12 w             0.5        0.25       0.25
## 2 AH2312         12 w             0.615      0          0.385
## 3 BE2005          9 c             0.333      0.5        0.167
This chunk takes loco_wide, selects just pp info and the new proportion columns and gathers them long again, arranging by pp_no.
gather_loco_long <- spread_loco_wide %>%
  gather(key = resptype, value = proportion, prop_aff:prop_action) %>%
  arrange(pp_no)

head(gather_loco_long, 3)
## # A tibble: 3 x 5
##   pp_no  age_months loco_stats resptype    proportion
##   <chr>       <dbl> <chr>      <chr>            <dbl>
## 1 AE1104         12 w          prop_aff          0.5
## 2 AE1104         12 w          prop_desc         0.25
## 3 AE1104         12 w          prop_action       0.25
There are so many helpful resources online that people have put together to help beginners get their head around what these functions are doing. These animations by Garrick Aden-Buie are awesome.
Animated #rstats data tidying with tidyr's spread and gather functions, brought to life using the new gganimate by @thomasp85.
— Garrick Aden-Buie (@grrrck) August 22, 2018
Source and more info: https://t.co/XuIo0KfgsD pic.twitter.com/se2EmNjxk8
BUT every time I want to do it, I find myself looking up these notes I made myself last year.
I don’t seem to be able to just remember the arguments that gather() and spread() need. Reassuringly, I’m not the only one and Hadley Wickham has recently done something about it, writing new functions to replace gather and spread.
Pivot wider and longer
NOTE: these functions are not yet on CRAN and to use them you need to install the development version from github.
# install.packages("devtools")
devtools::install_github("tidyverse/tidyr")
The new functions are called pivot_longer() (which replaces gather) and pivot_wider() (which replaces spread).
knitr::include_graphics("meme pivot.jpeg")

Lets try them out to make the loco data wide. For pivot_wider(), we need to know the df that we want to make wide, names_from = the column that contains the names to spread, values_from = the dv that you want to spread across columns.
df %>% pivot_wider(names_from = , values_from = )
#make data wide
pivot_loco_wide <- loco %>%
  select(-resp_type) %>%
  pivot_wider(names_from = resptype, values_from = count)

#get rid of NA, add extra columns
pivot_loco_wide <- pivot_loco_wide%>%
  replace_na(list(affirmative = 0, descriptive = 0, action_directed = 0)) %>%
  mutate(total = affirmative + descriptive + action_directed) %>%
   mutate(prop_aff = affirmative/total,
         prop_desc = descriptive/total,
         prop_action = action_directed/total) %>%
  select(pp_no:loco_stats, starts_with("prop"))

head(pivot_loco_wide, 10)
## # A tibble: 10 x 6
##    pp_no   age_months loco_stats prop_aff prop_desc prop_action
##    <chr>        <dbl> <chr>         <dbl>     <dbl>       <dbl>
##  1 AE1104          12 w             0.5       0.25        0.25
##  2 AH2312          12 w             0.615     0           0.385
##  3 BE2005           9 c             0.333     0.5         0.167
##  4 BE2005c         12 w             0.312     0.25        0.438
##  5 CF0509           9 w             0.5       0.312       0.188
##  6 EH1406          12 w             0.429     0.286       0.286
##  7 EI0105           9 c             0.5       0.5         0
##  8 FA1206          12 w             0.429     0.429       0.143
##  9 HR1503           9 c             0.286     0.286       0.429
## 10 HU0808           9 c             0.667     0           0.333
Awesome, now we can make the loco_wide data long…
The structure of pivot_longer() is the same but you tell it which columns to gather. Then the names_to = is the name of the column that will contain the names, and values_to = the name of the column with values in it.
Note for pivot_longer() but not pivot_wider(), you need to put the name of the names and values column in quotes. Presumably thats because those columns don’t exist yet?
df %>% pivot_longer(colsto:makelong, names_to = “namescol”, values_to = “valuecol”)
pivot_loco_long <- pivot_loco_wide %>%
  pivot_longer(prop_aff:prop_action, names_to = "resp", values_to = "proportion") %>%
  arrange(pp_no)

head(pivot_loco_long, 10)
## # A tibble: 10 x 5
##    pp_no   age_months loco_stats resp        proportion
##    <chr>        <dbl> <chr>      <chr>            <dbl>
##  1 AE1104          12 w          prop_aff         0.5
##  2 AE1104          12 w          prop_desc        0.25
##  3 AE1104          12 w          prop_action      0.25
##  4 AH2312          12 w          prop_aff         0.615
##  5 AH2312          12 w          prop_desc        0
##  6 AH2312          12 w          prop_action      0.385
##  7 BE2005           9 c          prop_aff         0.333
##  8 BE2005           9 c          prop_desc        0.5
##  9 BE2005           9 c          prop_action      0.167
## 10 BE2005c         12 w          prop_aff         0.312
I think they are more intuitive, but we will see how long it takes me to not need to refer back to these notes :)