lubridate characters to dates
Art by Allison Horst @allison_horst
So far I have learned that lubridate has some nice functions for pulling date components like day, month, or year and using them within group_by() and summarise() or ggplot(). But most of the time when I am working with date data in the real world, R doesn’t even think my dates are dates. Most of the time date data that I read into R gets parsed as characters. Next on the learning list….how to convert dates that R thinks are characters into date format.
There was a pretty fun Tidy Tuesday dataset last week that should be helpful for working this out.
load packages
library(tidyverse)
library(lubridate)
library(tidytuesdayR)
library(ggeasy) # for easy ggplot editing
library(harrypotter) # for palettes
read data
The Tidy Tuesday dataset contains lyrics, sales, and charts for both Taylor Swift and Beyonce. In terms of playing with dates, sales and charts are going to work best.
sales <- read_csv("sales.csv")

charts <- read_csv("charts.csv")
Both the sales and charts dataframes have a variable that contains the date when the albums were first released, but much like usually happens with my data in the real world, R thinks that this column is characters.
glimpse(sales)
## Rows: 48
## Columns: 5
## $ artist   <chr> "Taylor Swift", "Taylor Swift", "Taylor Swift", "Taylor Swift…
## $ title    <chr> "Taylor Swift", "Fearless", "Fearless", "Fearless", "Fearless…
## $ country  <chr> "US", "WW", "US", "AUS", "UK", "WW", "US", "UK", "WW", "US", …
## $ sales    <dbl> 5720000, 12000000, 7180000, 500000, 609000, 5000000, 4694000,…
## $ released <chr> "October 24, 2006", "November 11, 2008", "November 11, 2008",…
convert characters to dates
It is nice that the dates are in a consistent format (month, day, year). That should make it easy to convert them to date format. My first instinct is to try as_date(), but that doesn’t work.
sales$released <- as_date(sales$released)
## Warning: All formats failed to parse. No formats found.
I looked up the as_date() documentation. Does it need me to tell it there is no timezone (tz) and no format?
sales$released <- as_date(sales$released, tz = NULL, format = NULL)

glimpse(sales)
## Rows: 48
## Columns: 5
## $ artist   <chr> "Taylor Swift", "Taylor Swift", "Taylor Swift", "Taylor Swift…
## $ title    <chr> "Taylor Swift", "Fearless", "Fearless", "Fearless", "Fearless…
## $ country  <chr> "US", "WW", "US", "AUS", "UK", "WW", "US", "UK", "WW", "US", …
## $ sales    <dbl> 5720000, 12000000, 7180000, 500000, 609000, 5000000, 4694000,…
## $ released <date> NA, NA, NA, NA, NA, NA, NA, NA, NA, NA, NA, NA, NA, NA, NA, …
No that makes the variable into date format but makes all the values NA. Turns out you need to give R a hint about how to parse the date. In this case, we need to let R know that we are dealing dates in a month, day, year format using the mdy() function.
note: if your dates were in day, month, year format you would use
dmy()and if they were in year, month, day format you would useymd()
Lets try that again…
sales <- read_csv("sales.csv")
##
## ── Column specification ────────────────────────────────────────────────────────
## cols(
##   artist = col_character(),
##   title = col_character(),
##   country = col_character(),
##   sales = col_double(),
##   released = col_character()
## )
sales$released <- mdy(sales$released)
Better…. but 6 failed to parse, why is that? Ahhhh, there are some Beyonce dates include extra characters.
sales <- read_csv("sales.csv")

sales$released[[31]]
## [1] "June 23, 2003"
Use mutate and recode to get rid of the extra characters.
sales <- sales %>%
  mutate(released = recode(released, "June 23, 2003 (UK)[39]" = "June 23, 2003",
                           "September 1, 2006 (US)[51]" = "September 1, 2006"))
And try to parse the dates as myd() again.
sales$released <- mdy(sales$released)

glimpse(sales)
## Rows: 48
## Columns: 5
## $ artist   <chr> "Taylor Swift", "Taylor Swift", "Taylor Swift", "Taylor Swift…
## $ title    <chr> "Taylor Swift", "Fearless", "Fearless", "Fearless", "Fearless…
## $ country  <chr> "US", "WW", "US", "AUS", "UK", "WW", "US", "UK", "WW", "US", …
## $ sales    <dbl> 5720000, 12000000, 7180000, 500000, 609000, 5000000, 4694000,…
## $ released <date> 2006-10-24, 2008-11-11, 2008-11-11, 2008-11-11, 2008-11-11, …
Success!
Beyonce vs. Taylor: Sales by year
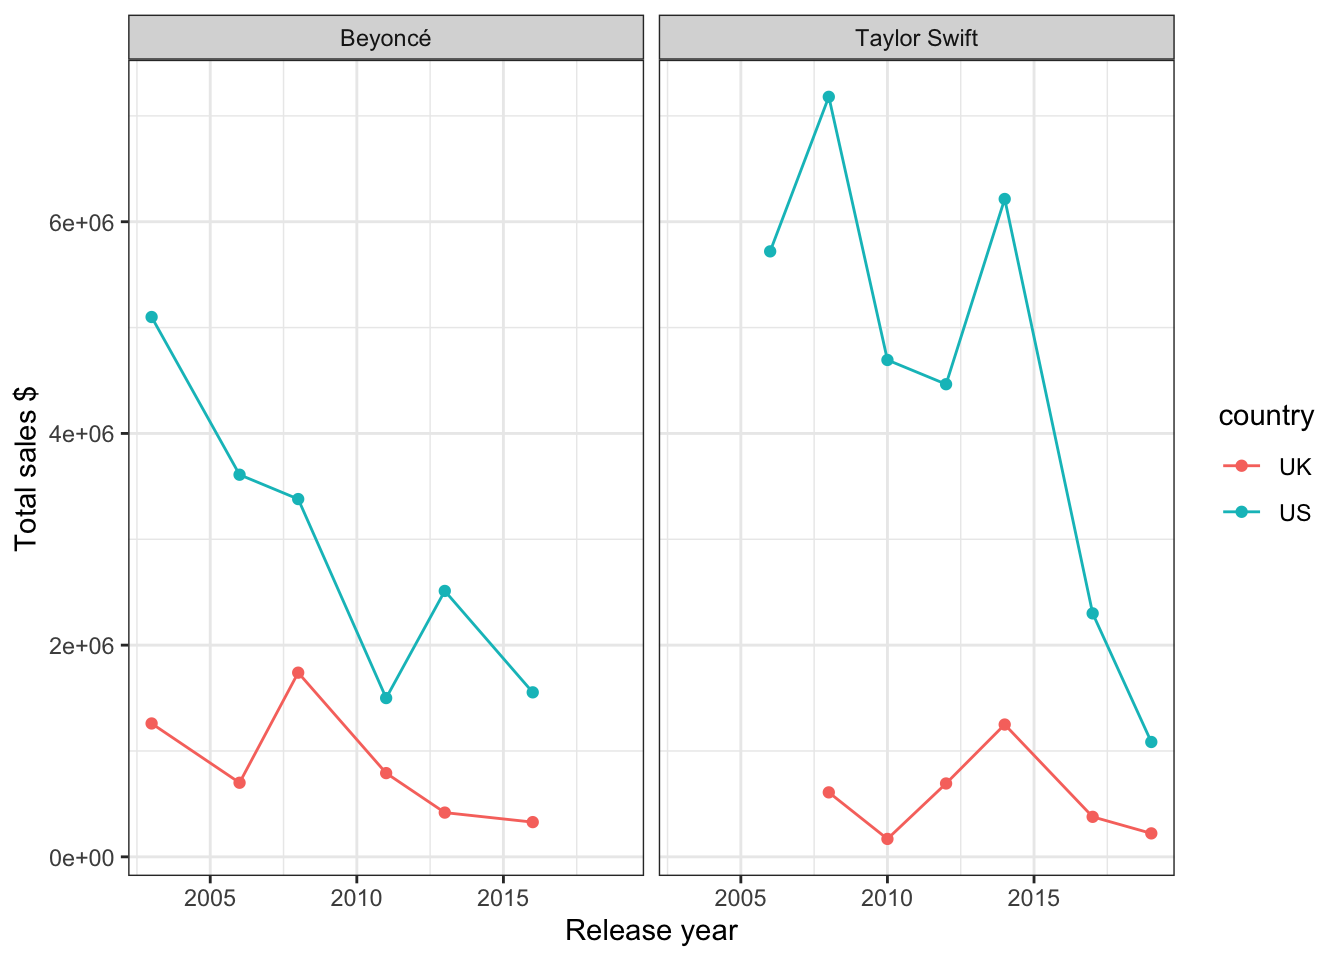
Now that we have the release date in date format, lets compare Taylor Swift and Beyonce US and UK sales by year.
The move to “pop” with her 1989 album in 2014 was a good one for Taylor Swift.
sales %>%
  filter(country %in% c("US", "UK")) %>%
  group_by(year(released), country, artist) %>%
  summarise(totalsales = sum(sales)) %>%
  rename(year = `year(released)`) %>%
  ggplot(aes(x = year, y = totalsales, colour = country, group = country)) +
  geom_point() +
  geom_line() +
  facet_wrap(~ artist) +
  theme_bw() +
  labs(y = "Total sales $", x = "Release year")
## `summarise()` has grouped output by 'year(released)', 'country'. You can override using the `.groups` argument.
Beyonce vs. Taylor: Chart position by year
First, fix the weird dates that won’t parse, then use mdy() to convert to date format.
charts <- read_csv("charts.csv")

charts <- charts %>%
  mutate(released = recode(released, "June 23, 2003 (UK)[39]" = "June 23, 2003",
                           "September 1, 2006 (US)[51]" = "September 1, 2006")) %>%
  rename(country = chart)

charts$released <- mdy(charts$released)

glimpse(charts)
## Rows: 140
## Columns: 8
## $ artist         <chr> "Taylor Swift", "Taylor Swift", "Taylor Swift", "Taylor…
## $ title          <chr> "Taylor Swift", "Taylor Swift", "Taylor Swift", "Taylor…
## $ released       <date> 2006-10-24, 2006-10-24, 2006-10-24, 2006-10-24, 2006-1…
## $ re_release     <chr> "March 18, 2008[34]", "March 18, 2008[34]", "March 18, …
## $ label          <chr> "Big Machine", "Big Machine", "Big Machine", "Big Machi…
## $ formats        <chr> "CD, CD+G (karaoke), DVD (karaoke), LP, digital downloa…
## $ country        <chr> "US", "AUS", "CAN", "FRA", "GER", "IRE", "JPN", "NZ", "…
## $ chart_position <chr> "5", "33", "14", "—", "—", "59", "53", "38", "—", "81",…
charts %>%
  ggplot(aes(x = year(released), y = chart_position, colour = country, group = country)) +
  geom_point() +
  geom_line() +
  facet_wrap(~ artist) +
  theme_bw() +
  labs(y = "Chart position", x = "Release year")
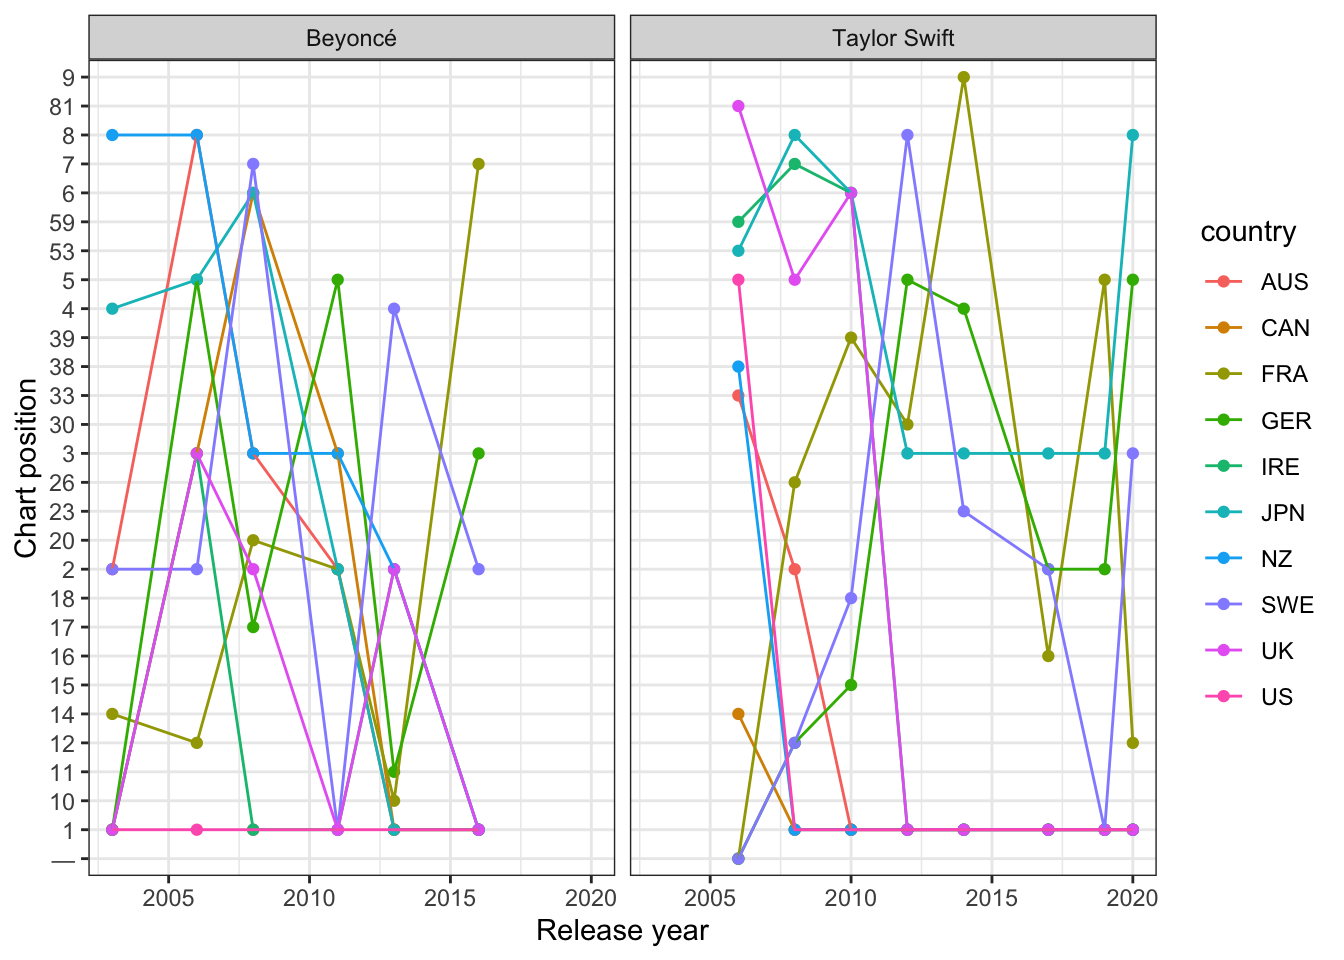
Whoa that is a crazy plot, maybe need to make the chart position numeric!
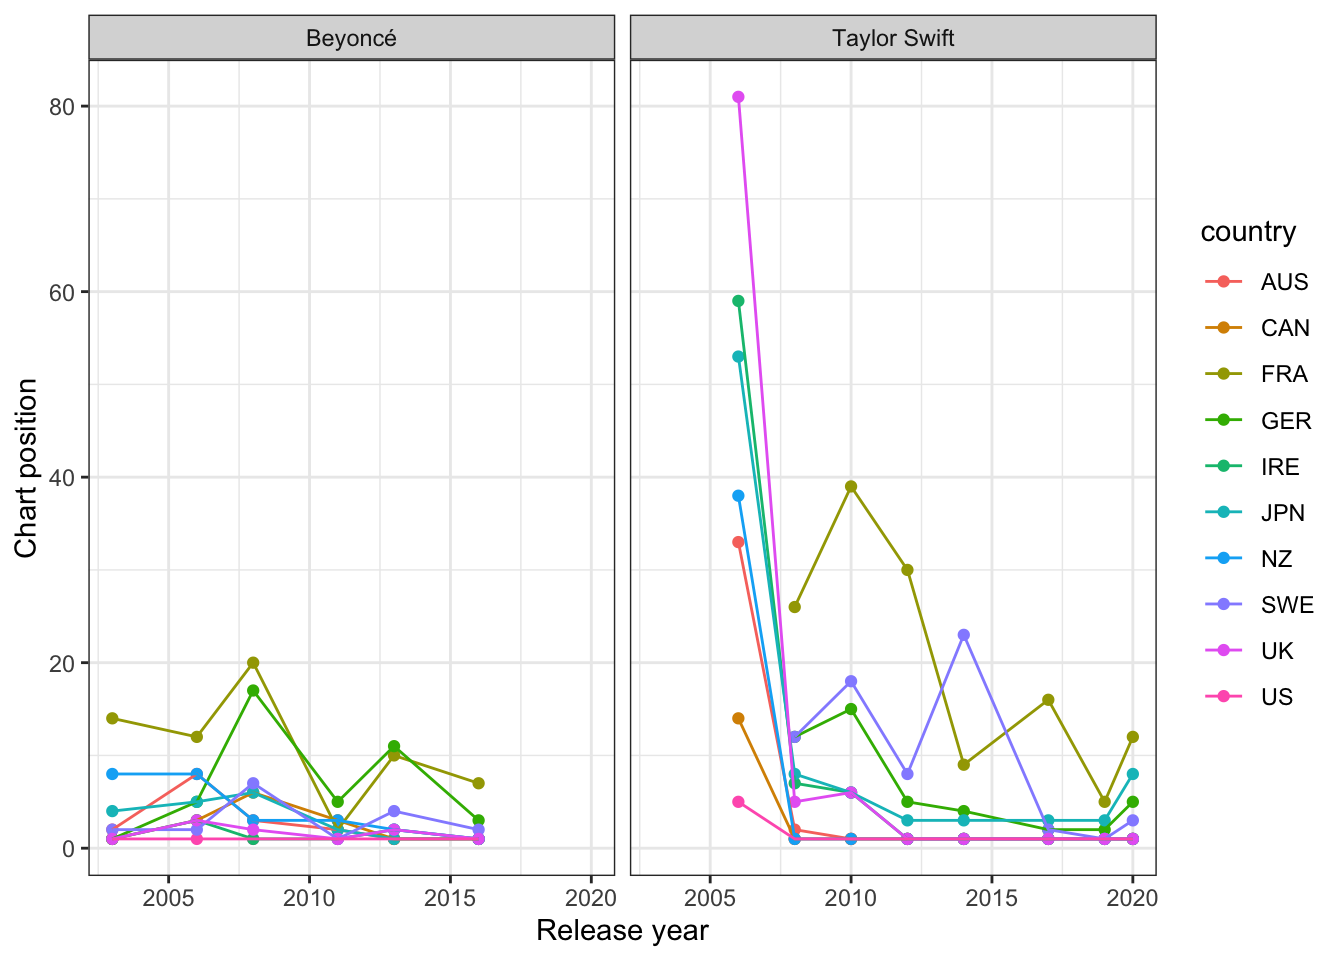
charts$chart_position <- as.numeric(charts$chart_position)
## Warning: NAs introduced by coercion
It is clear that Beyonce’s chart position benefited from her Destiny’s Child fame and that Swede didn’t like Taylor Swift’s shift to pop in 2014 as much as the rest of the world.
charts %>%
  ggplot(aes(x = year(released), y = chart_position, colour = country, group = country)) +
  geom_point() +
  geom_line() +
  facet_wrap(~ artist) +
  theme_bw() +
  labs(y = "Chart position", x = "Release year")
## Warning: Removed 3 rows containing missing values (geom_point).
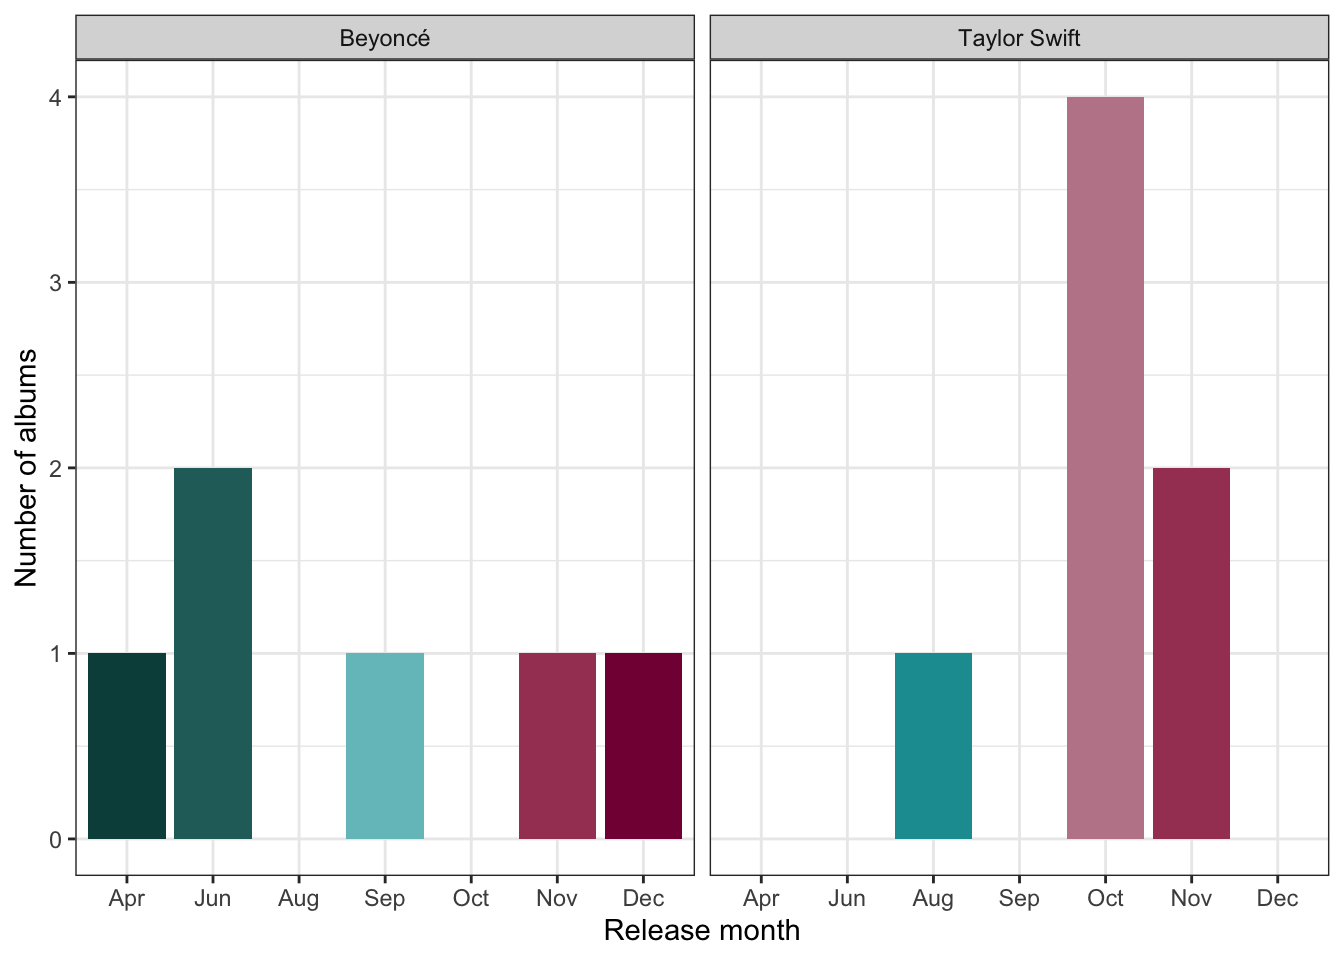
What time of year do Beyonce and Taylor release albums?
Taylor has a clear preference for October release.
sales %>%
  filter(country == "US") %>%
  ggplot(aes(x = month(released, label = TRUE), fill = month(released, label = TRUE))) +
  geom_bar() +
  facet_wrap(~ artist) +
  labs(x = "Release month", y = "Number of albums") +
  theme_bw() +
 easy_remove_legend() +
  scale_fill_hp_d(option = "LunaLovegood")
What have I learned about lubridate now?
If your dates are all in a consistent format, it is pretty easy to turn dates that R thinks are characters into dates, using the mdy(), dmy(), or ymd() functions.
What about if your dates are not in a consistent format? If you have mistakenly let your participants fill in a field with how they like to see dates?
And why does R sometimes think dates are characters and other times not? How do I maximise the likelihood that R will think my dates are dates from the get go?